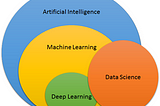
Pavini JainDifference between AI, ML, and DLArtificial Intelligence or AI works without human interference.Sep 12, 2021Sep 12, 2021
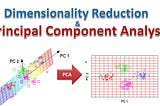
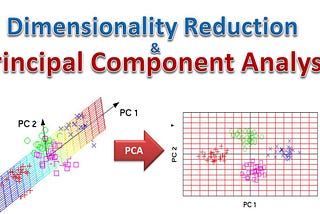
Pavini JainPrincipal Component AnalysisPrincipal Coponent Analysis, or PCA, is a dimensionality-reduction method that is often used to reduce the dimensionality of large data…Jul 19, 2021Jul 19, 2021
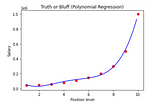
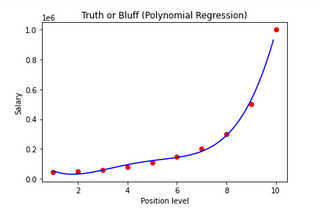
Pavini JainPolynomial RegressionIn this module, we will learn about Polynomial Regression and how it works. In the end, we will perform polynomial regression for the…Jul 1, 2021Jul 1, 2021
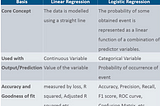
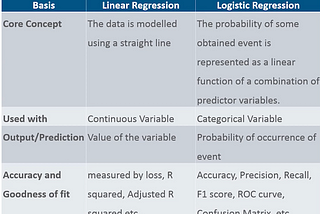
Pavini JainLinear RegressionRegression analysis is a form of predictive modelling technique that investigates the relationship between a dependent and independent…Jun 25, 2021Jun 25, 2021
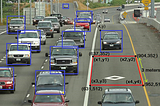
Pavini JainUnderstanding OpenCVIn this blog, I will be sharing with you about my experience in OpenCV.Jun 24, 2021Jun 24, 2021
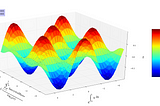
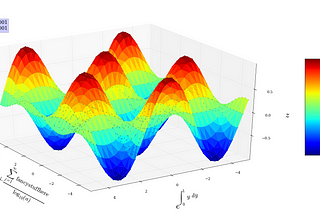
Pavini JainExploring Matplotlib and SeabornMatplotlib is a plotting library for the Python programming language and its numerical mathematics extension NumPy. Seaborn is a Python…Jun 13, 2021Jun 13, 2021